Linear Inequations with two
Variables
At the end of this lesson, you should be able to:
- Find the solution of a linear inequation with the formula
.
- Graph the region in the plane that represents the solution of any
linear inequation of any two variables.
An inequation with two variables is an inequation that can be
written like:
or any expression of the previous form where, in the place of the
symbol < includes any other symbol of inequality: > , ≤
o
where a, b and c are constants and
x and y are variables. Solve and inequation in two
variables consisting of finding all the pairs of values of (x,y)
for those that equal the difference.
Like we saw in the tutorial of linear equations of a
dimension, we can change the sign of the inequality by the same sign,
we find an equation that comes to be the beginning of the solution of
the inequality. For example, consider the following inequality:
.
Changing the sign < for the sign = we find the
equation:
. The graph of this equation is a line that divides
the plane in two regions as shown in the following figure:
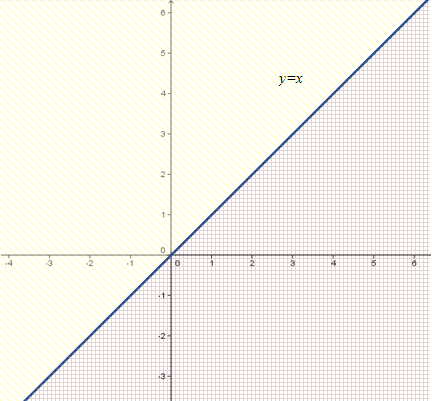
We take any point in the red region, for example the point (1,-1).
Where x=1 and y=-1. Such as -1<1, this pair of values
satisfies the inequality:
.
We take another point in the red region, for example the point
(2,1). Where x=2 and y=1. Such as 1<2, this pair of
values satisfies the inequality:
.
Try to find a point in the red region where
. You will see that it is not possible to find a point that
fills these requirements.
In conclusion, any point of the red region that satisfies the
inequality .
In the same way, any point in the yellow region, satisfies the
inequality . Check it selecting points across the yellow region.
In general, at the change of the sign of inequality for the sign =
we find an equation of a line that comes to be the beginning of the
solution of the inequality.
Press the button below to practice visualizing how similarities
divide the plane xy

To solve an inequation of the form:
or any expression of the previous form that, in place of
the symbol < includes any other symbol of inequality: > , ≤ or
≥, we continue with the following steps:
- Replace the sign of inequality for the sign =
and divide the cartesian plane taking the beginning of
the line that represents the equation.
- Take points of test in every region and verify if they
satisfy the inequality.
- Graph the solution, having the total that is the inequality
≥ or ≤ the beginning is included in the solution, in case the
opposite of the beginning is not included.
Example 1:
Solve the following inequation
Solution:
Step 1: Replace the sign of inequality for the
sign =, we get the following equation
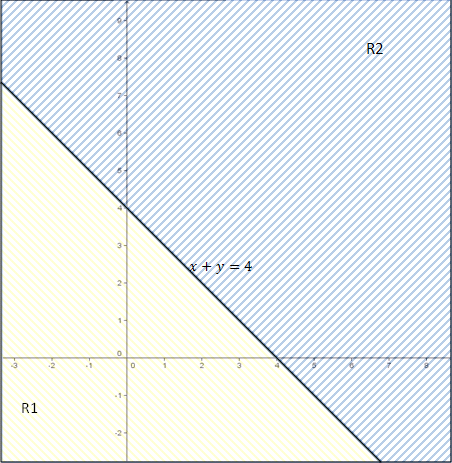
. To graph a line, it is sufficient to find the two
points. One simple way of graphing the line is to find the
intercepts with the axis:
To find the intercept with the axis x, we do y=0,
To find the intercept with the axis y, we do x=0,
The graph is the following. This line divides the plane in two
regions R1 and R2.
|
Step 2: Take points of test in every region
and verify is they satisfy the inequality.
|
|
Point of test in R1 (0,0)
Like the expression is true, then this is the region
that represents the solution of the inequation.
|
Like we already determined in the solution, it is not
necessary to select a point of test in the other region. You
can try any point in the other region that does not satisfy the
inequality.
|
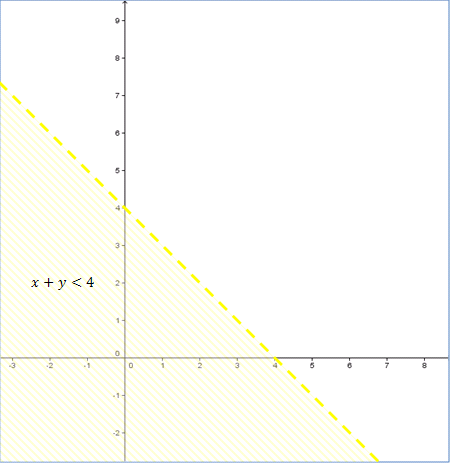
Step 3: Graph the solution. Like the sign of
the inequality is < one cannot include the beginning as part
of the solution. To denote this graphically, we utilize
discontinuous lines in the beginning.
|
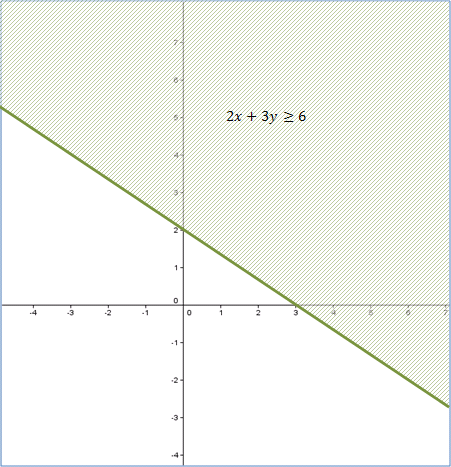
Example 2:
Solve the following inequation
Solution:
Step 1: Replace the sign of inequality for the
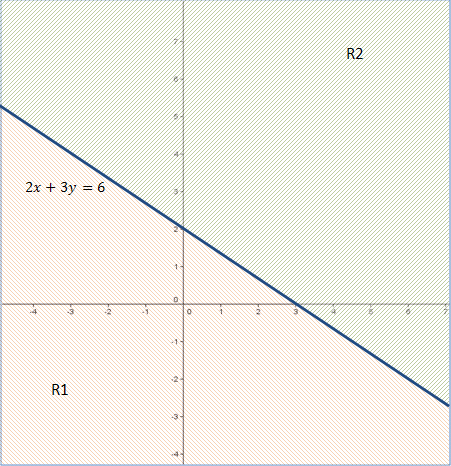
sign =, we find the following equation
. To graph a line, it is sufficient to find two points.
A simple form of graphing the line is to find the intercepts
with the axis:
To find the intercept with the axis x, we do y=0,
To find the intercept of the axis y, we do x=0,
The graph of the line is the following. This line divides the
plane in two regions R1 and R2.
|
Step 2: Take points of test in every region
and verify if they satisfy the inequality.
|
Point of test in R1 (1,1)
Like the expression is false, then this region is not
the solution of the inequality.
|
Point of test in R2 (3,4)
Like the expression is true, then this region is the
solution of the inequality.
|
Step 3: Graph the solution. Like the sign of
the inequality is ≥ one can include in the beginning as part
of the solution. To denote this graphically, we utilize a
continuous line in the beginning.
|
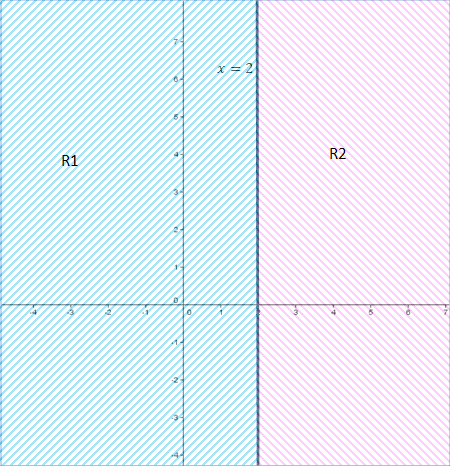
Example 3:
Solve the following inequality in two dimensions
Solution:
Step 1: Replace the sign of inequality for the
sign =, we find the following equation
. This equation corresponds to a vertical line with the
intercept in the point x=3.
|
Step 2: Take points of test in every region
and verify if it satisfies the inequality.
|
Point of test in R1 (0,0)
Like the expression is false, then this region is not
the solution of the inequality.
|
Point of test in R2 (3,3)
Like the expression is true, then this region is the
solution of the inequality.
|
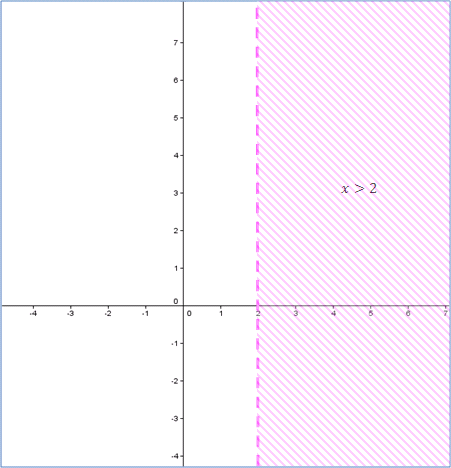
Step 3: Graph the solution. Like the sign of
the inequality is > it cannot be included in the beginning
like part of the solution.
|
Press the button below to practice graphing regions of inequality in
the plane xy.
Press the button below to practice exercises of regions of
inequations in the plane xy.
Now that you ahve completed this lesson, you should be able
to:
- Find the solution of a linear inequality in the form of
.
- Graph the region in the plane that represents the solution of any
linear inequality with two variables.
|

