Linear Equations with Two Variables - Part 1ObjectivesAfter completing this lesson, you will be able to:
Introduction
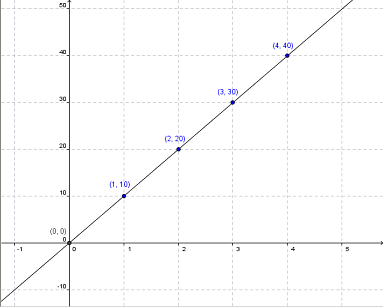
If Julie earns $10.00 per hour, the table and graph above show a relationship between x, the hours she worked, and y, the dollars she earned. When the value of x increase by 1, the value of y always increases by 10. So the rate of change is 10 and is a constant. In the lesson on Direct Variation, you saw several examples where the change reason is constant. Since all the direct variation examples satisfy y = kx, where k is constant, they all include the point (x, y) = (0,0). The following linear relationship example is similar, but point (x, y) = (0,0) is not included, therefore it is not a direct variation relationship.
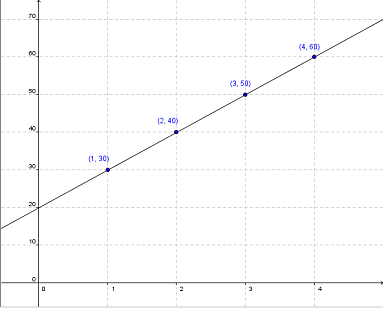
If Mark opens a bank account with $20.00 and deposits $10.00 every week, the graph above shows the relationship between x, the number of elapsed weeks, and y, the dollars Mark has in the bank. Some observations:
Linear relationships are similar to direct variation relationships since the rate of change (slope) is constant in both, but unlike direct variation relationships, linear relationships can include point (0,k) where k is different from 0. DefinitionsGiven a relationship between two variables x and
y, the relationship is linear if the rate of change is
constant, i.e., when x increases by 1, y always
increases by a constant value.
If you begin with 15 cookies and one cookie costs 20 cents, the table above shows the relationship between x, the amount you spent, and y, the number of cookies you have. Some observations:
Rate of Change and SlopeIn order to better understand the concept of rate of change or slope, we will clarify certain special notation which is used when referring to this topic.
In the above application, complete the following steps:
The following table show the relationship between run and rise for this line:
Use the above application to find runs and rises consistent with slopes of 3, 1, 0.5, -0.5, -1 and -2.
When the slope is a fraction, it is not always convenient to think of the run as being equal to 1. In these cases, it helps to remember that . For example, consider that
So , with each advance of 1 in direction x, we raise in direction y. Also, with each advance of 3 in direction x, we raise 2 in direction y. So given a fraction slope: . Then, if the run is Δx, the rise is Δy. Use the following application to practice how to respond to questions related to slopes: Finding the Formula for a Linear RelationshipExamples:The following interactive application will allow you to find formulas for linear relationships. Use the sliders to change the values of b, the y-intercept, and m, the slope. Then click the button to build the relationship and reveal the formula. Generalization: Consider a line that has a y-intercept of b and whose slope is m. A y-intercept of b signifies that when x = 0, y = b. A slope m means that every time x increases by 1, y increases by m units. Beginning at point (0,b) and increasing y by m units each time x increases by 1 produces the following table:
This same table can be rewritten expressing y as b plus the number of m's that have been added.
It should be made clear that the values of x and y
have not changed in these tables. However, on the second table, we can
quickly see that y = b + something × m. This observation
permits us to conclude that the something is in reality x
. So the relationship between x and y can be
expressed as y = b + m × x. Another representation of this is
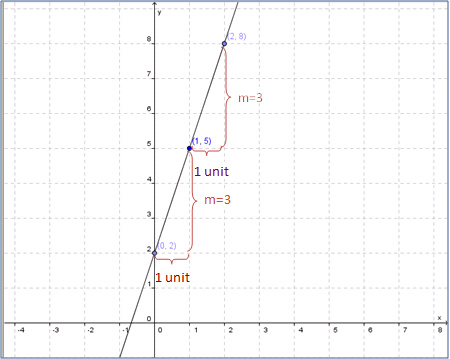
which is one of the general formulas for a linear relationship. Graphing Linear RelationshipsExamples:Example 1: Plot the graph of the linear equation y = 3x + 2. Since the y-intercept is 2, we know the line passes through point (0,2) and since the slope is 3, the line increases 3 units for each unit the line moves to the right, as shown in the following figure:
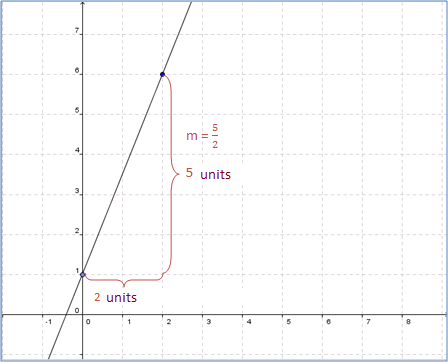
Example 2: Plot the graph of the line which has a y-intercept of 1 and a slope of . Since the y-intercept is 1, we know the line passes through point (0,1) and since the slope is , the line raises units for each unit the line moves to the right. Then, for every two units the line moves to the right, the line raises units. This is equivalent to saying that for each two units the line moves to the right, the line raises 5 units, as shown in the following figure:
Example 3: In the application shown below, complete the following steps:
Practice: In the application shown below, complete the following steps:
SummaryNow that you have completed this lesson, you should be able to:
|
Northern Kentucky University, MEP 475
Highland Heights, KY 41076
ph: 859-572-7690, fax: 859-572-7677
kcm@nku.edu