Graphing and Modeling Quadratic FunctionsObjectivesAfter completing this lesson, you will be able to:
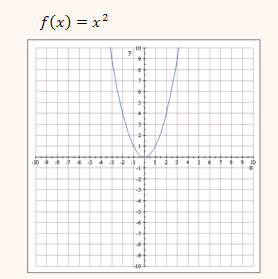
IntroductionThis section assumes that you've studied quadratic functions and their roots previously. Please click here if you wish to review these topics. Quadratic functions can be used to model data and be analyzed in a great variety of real-life applications. In this lesson, we will study the quadratic function graphs and how to use them to model diverse problems. We saw in the section on transformations (click here to review) that the standard form shown below allows us to visualize the graph of a quadratic function by starting with f(x) = x2 and performing various transformations to arrive at the graph of a quadratic function in standard form. Standard Form of a Quadratic Function.
Converting an expressed function in general form to its standar formAny quadratic function can be expressed in standard form:
The way to achieve this is by using the method of completing the squre.
Example 1: Write the function in standard form. Solution:
Example 2: Write function in standard form. Solution:
Click on the following link to practice the standard form of a quadratic function:  Graph of quadratic functions.Graph .The graph of function: is the following:
The graph of a quadratic function receives the name, parable. These always have an extreme value called vertex of the parable. This value is very important practical applications when we want to find the maximum or minimum value of a quadratic function, as we observe later on, when we develop the application problems.
GraphThe standard form is very convenient in order to draw the parable, applying transformations to graph .
The transformation of functions is explained in detail in the tutorial Transformation of Functions. Example 1: Graph function Solution:
Example 2: Graph function Solution:
Maximum and Minimum ValuesBy observing the graphs in the previous examples, we see the extreme value of the function occurs right in the vertex, which is easy to distinguish when we have the function written in standard form.
Example: Given the following function
Solution:
The formula indicates that the parable has a minimum value, since a=5 is positive. As we observe in the graph, the vertex of the parable is (3,4) and it opens upwards. The minumum value is f(3)=4. ModelingIn the following application, we will model the trayectory of a cannonball. This trayectory has the form of a parable. On the right side, we see the quadratic function written in standard form. On the left side, we see three line segments which represent the values that parameters a, h and k can take on, which correspond to this function. Moving the corresponding points, changes the values of these parameters, and therfore, changes the graph. Test by moving the points and observe the changes produced in the graph and in the equation. The objective of this exercise is to move the points in order to change parameters a, h y k in such a way that the parable obtained coincides with the trayectory of the cannon, demonstrated in e forma tal que la parábola obtenida coincida con la trayectoria de la cannonball, shown in dotted lines. Once you have achieved this, you will observe on the right side the equation which corresponds to the cannonball.
Application ProblemsExample 1: A ball is thrown in a playing field. Its trayectory is given by the function:
Solution:
Since the function represents the height the ball travels, its maximum height is k=16. The maximum height is reached when x =h=12. It is also easy to find these values by observing the graph. Example 2: Find two positive real numbers a and b whose produce is the maximum, and also satisfy that a + 2b = 24 Solution: We want to model function p so it expresses a product of a y b. p = a × b We have two variables. We can use the second condition to write the variable a in terms of b. a + 2b = 24 where a = 24-2b We rewrite our function in terms of b.
By observing the standard form of the function, we see the maximum value is reached when b =6. Now, we calculate the vaue of the second variabe using the expression a = 24-2b where a=12. Click on the following link to practice application problems. SummaryNow that you have completed this lesson, you should be able to:
|
|||||||||||||||||||||||||||||||||||||||||||||||||||||||||||||||||||||||||